Without a doubt, Python has become one of the leading programming langueages when working with data. It might not be the best in terms of performance but its relatively easy to learn and write.
In this blog series, I want to give you an introduction how to use Python inside PowerBI / PowerQuery and how we can easily manipulate data using Python.
What we need:
1. PowerBI Desktop
2. Python – Download
3. panda – not our fluffly bamboo eating friend; the software libary we can use in python
– Download
– More Info
Befor we start:
Check if everything was installed propperly:
Press Windows Key and type „CMD“ to open command prompt window.

- Type „python“ to check if python is installed correctly.
2. Next command you want to execute in the command prompt window is „pip install pandas“
Easy Task:
So, this demo is ment to be a „first step“ into PowerQuery with Python. In future posts more advanced transformations will be covered!
What we want to do:
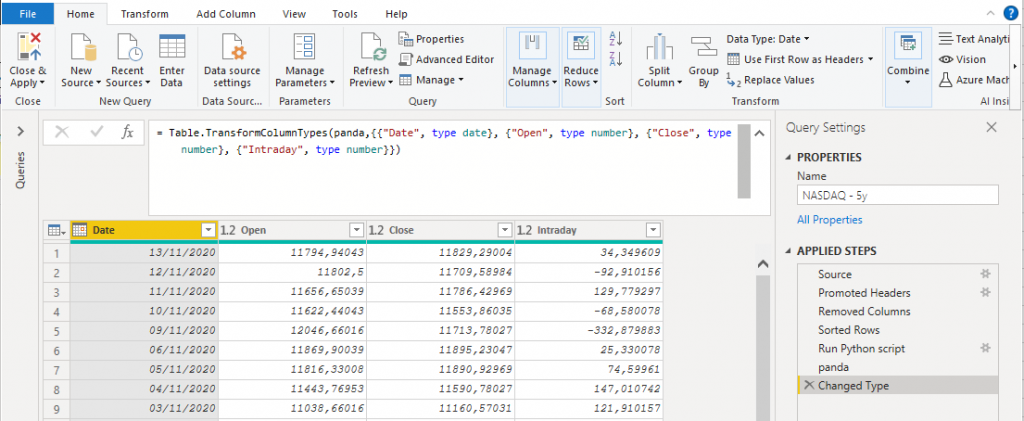
We want to create a new column which shows us the intraday movement of the Nsadaq index price
For this demo, we will take a look at the last 5y of Nasdaq.
Simply download historical data from:
Yahoo Finance
or here:
Now lets jump into PowerBI and get this data.
Lets Go:
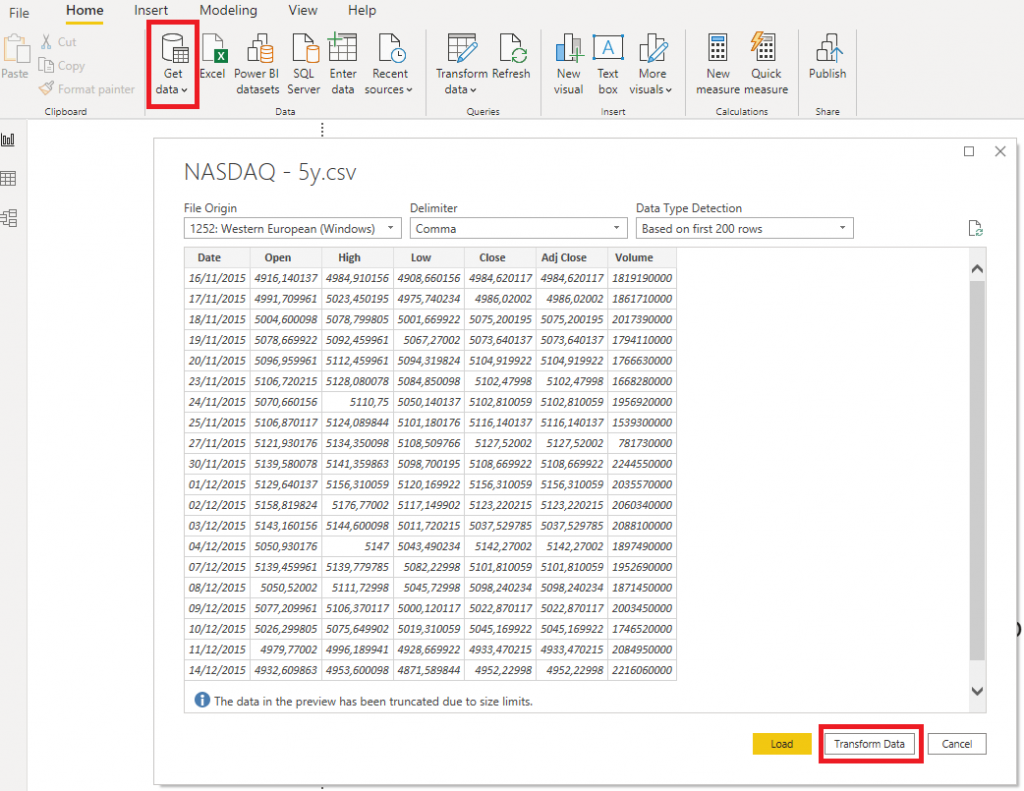
- We want to „Get data“ from the downloaded „Text/CSV“ file:

2. Focus on columns „Date“, „Open“ and „Close“. So we simply delete the others.

3. Goal:
Now we want to know the intraday. So the difference between close and open price . Or in other words:

I know I know, this could easily be done with M or DAX, but let try with Python.
4. Python Script:
I highly recommand doing all datatype changes after you ran your Python script!

Alright, so now we need to write python.

The data can be found in ‚dataset‚. So lets import the panda lib and use the .DataFrame function to work with the table.
Copy & Paste:
import pandas as pd
panda = pd.DataFrame(dataset)
panda[„Intraday“] = panda[„Close“] – panda[„Open“]
5. Finish
Next up, we need to call the table, change datatypes and we are done with this simple exercise:

