Hello and welcome,
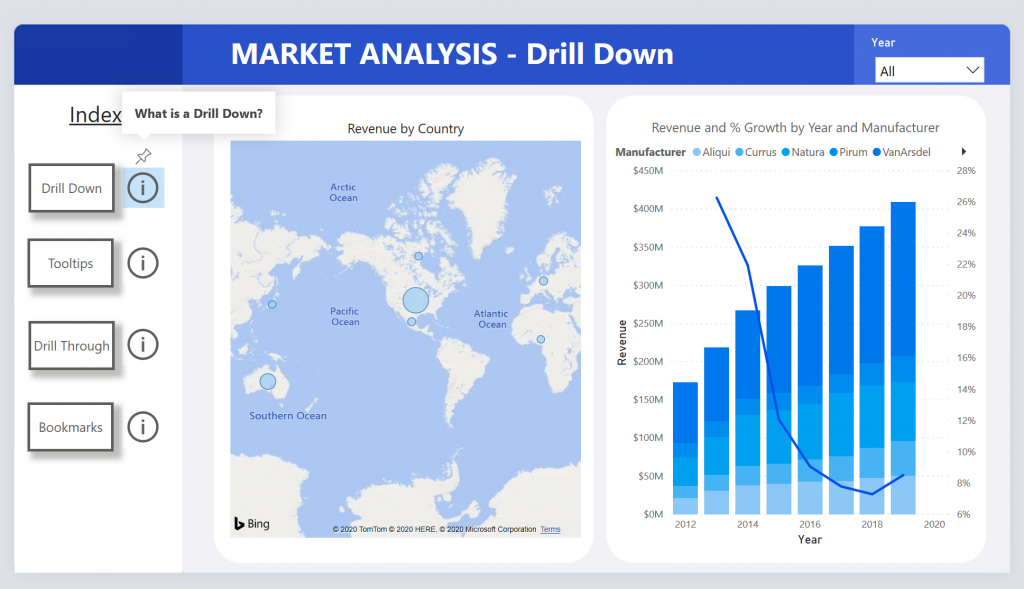
for all of you who like to have a nice demo report with the visualization features ( Bookmarks, Drill down, Drill through and Tooltips ) in Power BI can download this report.
It is based on the Microsoft data from the DIAD workshop.
I hope this report will help to understand how this features are working because they are really cool ;).
Here you can download the file:

and here you can view the report in your browser:
I would like to hear if you find this report useful and for what purpose you would use it?
Best,
Kathrin
